
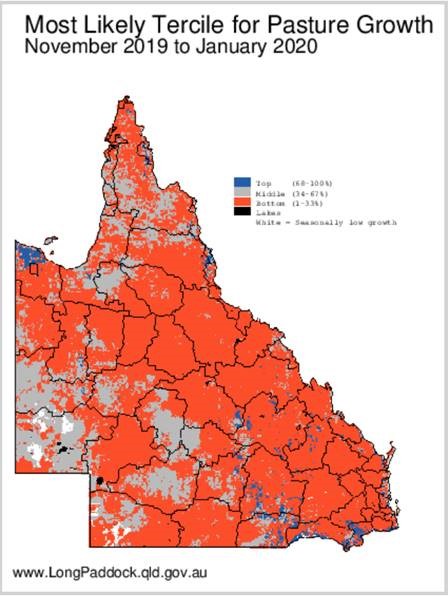
 Check out the new Most Likely Tercile for Pasture Growth three month outlook map on the Long Paddock website.
Knowing what tercile the upcoming seasonal pasture growth could be in (by sorting the data into bottom, middle or top groups) adds another level of detail for awareness and decision making.
For example, if your next three months summer pasture growth outlook is in the bottom tercile (as shown to the right), you may opt to take early action to adjust stock numbers.
Our maps showing Chance of Exceeding Median Rainfall or Chance of Exceeding Median Pasture Growth are still useful, however, the new map essentially combines these “chance of exceedance” tercile maps into one—the “Most Likely Tercile”.
The Most Likely Tercile for Pasture Growth map for your state (or Australia) is found on the AussieGRASS page.
Select your state in the “Region” drop-down (e.g. Queensland) and then select the Most Likely Tercile map in the “map type” drop down list.
The Most Likely Tercile for Pasture Growth map is updated several times during the month as rainfall and climate data become available for us to use.
