Representative herd templates for northern Australia
A significant volume of representative herd data for northern Australia was produced in a large modelling exercise, conducted under the auspices of the Beef CRC and assisted by experienced extension officers familiar with production systems for each region in Queensland, Northern Territory and Western Australia.
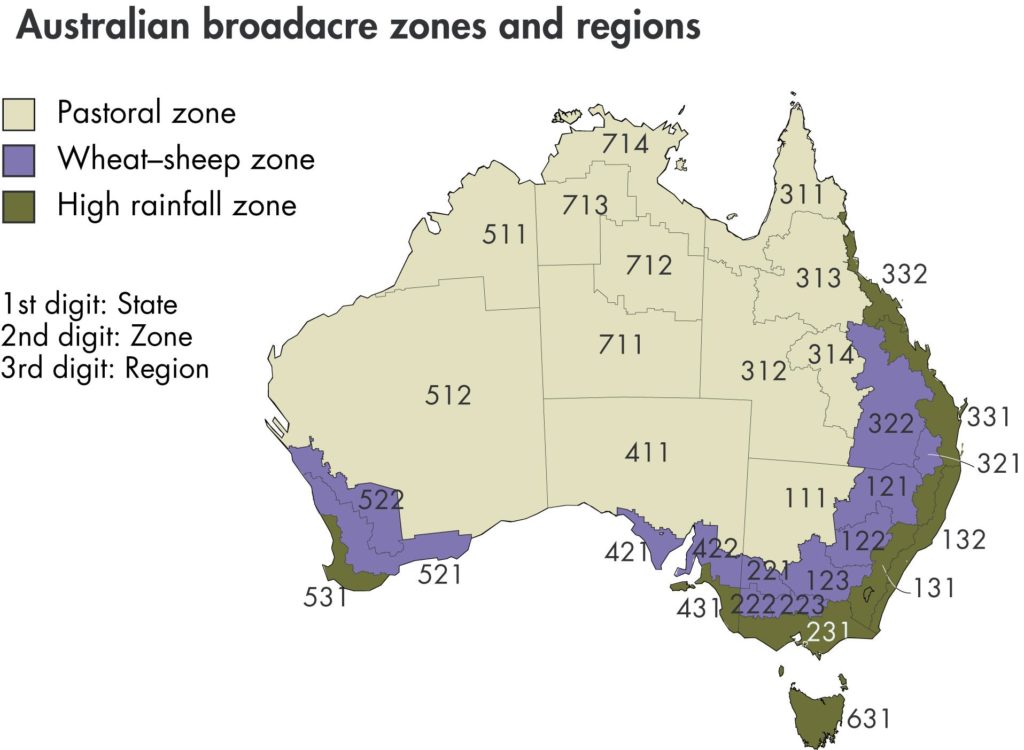
The Beef CRC templates were stable state representations of breeding beef herds, generated using Breedcow & Dynama. These were based on ABARE survey regions of northern Australia (Source: ABARE). Templates covered all of Queensland and Northern Territory, and Western Australia Region 511, and part of Region 512 north of 26° latitude (level with the Northern Territory/South Australia border).
Whilst data is provided for production systems broadly representative of the regions, this data should not be used to represent possibilities for particular properties.
The purpose of the templates were to provide a base scenario that could be modified to reflect the impact of Beef CRC research findings, for the purpose of valuing those findings.
How the data was collated
Some regions were represented by a single template, whilst others were represented by up to five templates. This was the choice of the officers providing the data. Multiple templates were used to represent different production systems of different types of country. There was no conscious attempt to represent local government areas or statistical regions.
The number of breeders for each region was determined from ABARE estimates based on ABARE survey properties. For regions represented by more than one template, breeder numbers were allocated to templates using ABS shire-based statistics or estimates from local extension officers.
It could be argued that a suitable representation of the breeding herd would have the male cattle sold or transferred out as weaners. Our investigations however indicate that the market price for weaners undervalues them relative to their opportunity cost. The profit centre of most breeding herds, even in poor country, is the value that can be added to steers by keeping them for varying periods past weaning. Thus, evaluations were done using herds set for whatever age of male turnoff was provided for the templates.
Prices used in the templates were chosen by the officers providing the information. These prices were based on prices being received at the time but judged across the season rather than on a particular day. Prices also reflected regional differences. Files were dated to indicate the general price environment when the files were created.
Example of data produced
For this illustration, the data is split into that part of the profit (gross margin or GM) generated by the breeders, and the part generated by growing out the steers. Grow out was to ages ranging from a year and a half (live export) to four and a half years. Weaner steers were ‘sold’ from the breeding enterprise at market value to the steer enterprise at ages of five to nine months. Prices were estimated in April and May 2011, before the live export ban. This data aims to represent the whole herd in the defined area.
| Herd GM/AE | Breeder GM/AE | Steer GM/AE | Total AE % | Breeder AE % | Steer AE % | % GM steers | |
|---|---|---|---|---|---|---|---|
| Queensland | $186 | $159 | $265 | 100% | 74% | 26% | 37% |
| Northern Territory | $110 | $82 | $349 | 100% | 90% | 10% | 33% |
| Western Australia north of 26° latitude | $103 | $69 | $315 | 100% | 86% | 14% | 43% |
| Overall | $173 | $143 | $271 | 100% | 77% | 23% | 37% |
Note that although the steer GM is the profit centre of the herd, the steers comprise the smallest part of the herd. The most profitable part of the steer enterprise, measured as GM/AE, is the first year after weaning, assisted by the lower AE ratings (weaners eat less than adults).
Results indicate the highest GM/AE coming from steers, with the smallest proportion of the herd comprising steers, because turnoff is predominantly at a year and a half. The percent of total GM from the steer part of the herd indicates the disproportionate contribution of the steers.
Written by Bill Holmes, formerly Queensland Government.
