Enhanced FORAGE Crop Frequency report mapping
The FORAGE Crop Frequency report provides a range of maps and information regarding the presence and frequency of crops for up to a 10-year period for selected Lot(s) on Plan.
The report has now been enhanced to include a larger area of Queensland’s cropping area – and can also detect the frequency of individual crop groups.
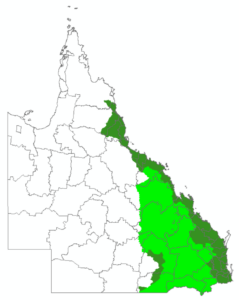
The expanded area is shown below (Figure 1) to include crop areas in the far north (i.e. Douglas shire, Tablelands regional and Burdekin), to the west (Central highlands and western downs regions), as far south as the Qld/NSW border (Balonne and Goondiwindi shires).
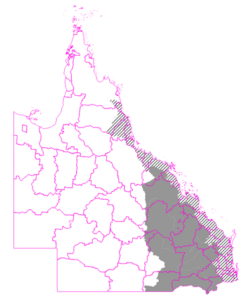
Summer-growing crops (Figure 2) can now identified grouped as banana, cotton, sugarcane, and ’other’ (predominantly sorghum and maize, but may also include mungbean, peanut, and soybean). Winter-growing crops are grouped as ’cereal’ (i.e. wheat, oats, barley) ) and chickpea.
A set of composite satellite images (February/September) are also included showing cropped areas that will generally appear bright green compared with the surrounding landscape.
Lastly, a time-series graph showing the proportion of the selected area that was cropped in summer (November of the previous year to May) and winter (June to October).
The uses for the Crop Frequency report include:
- An objective opinion on a property’s history when buying, selling, investing, or querying rate evaluations.
- Demonstrating, for example, high-value land use to respond to a development proposal (e.g. gas wells, road/rail planning).
- Demonstrating crop activity with: climate variability, seasonal crop split, indicative crop vigour and size/extent of crop
- Indication of crop type over time.
Go to the FORAGE Crop Frequency report for more information, or go straight to the FORAGE request page to order a report for high quality crop frequency information for Queensland properties in the designated cropping regions.