The path to enlightenment is through….poo?
The North Queensland sown pastures team have been stalking cattle to collect fresh dung samples to better understand the benefits of adding pasture legumes into native or sown grass pastures. Once found, the insides of the dung pats are carefully removed, combined with those of at least another six animals, bagged and tagged and dried ahead of shipping for analysis. Why do this?
Key take-home messages
- Faecal sampling can be used to understand what cattle are actually eating in your paddock
- The North Queensland sown pastures team have been using faecal sampling to compare the diet quality of grass and legume systems with mostly native pastures in the dry zone of north Queensland
- The sampling has shown grass legume systems provide a high-quality diet in the dry season when the quality of grass pastures decline.
In this article:
The missing bit of the jigsaw
Faecal NIRS lets us estimate what’s going in
First go with 2 new pastures
How did the results pile up?
So, is it all down pat?
Missing bit of the jigsaw
Through 10 years of small plot pasture trials on northern beef properties, the Mareeba based team have identified well-adapted pasture legumes by measuring their yields and collecting leaf and stem samples at different times of the year for feed value analysis. From that work, it was shown that legumes can grow well in the dry season when the feed value of native grasses declines. Importantly, the legumes had very high-quality leaf with crude protein values in the order of 15-20% and metabolisable energy of 8-9 MJ/kg dry feed. The stem however, was relatively low in quality and similar to the hayed-off grasses. However, these measures showed what was available to the grazing animal, but not necessarily what was selected by cattle and actually eaten.
The team are now scaling up the research to paddock-scale to better understand and demonstrate the benefits of developing legume-grass production paddocks to beef producers in the North. To do this, pasture production and feed quality is combined with weighing cattle – an important part of this is understanding what cattle are eating and how this compares with what they are getting in pastures without sown legumes. This will demonstrate the real-world benefits of adding legumes and can help guide grazing management for better long-term production and pasture health.
Faecal NIRS lets us estimate what’s going in
The analysis of dung samples using a relatively new method called Faecal Near Infrared Reflectance Spectroscopy (FNIRS) enables us to get an insight into the diet of grazing animals, and is particularly helpful in extensive grazing situations. Key measures include dietary crude protein, dry matter digestibility (which is directly related to metabolisable energy) and the proportion of non-grass material in the diet. This information can be used to understand animal growth rates. The quality of the diet can also be used to make decisions about when is a good time to move or sell cattle, or supplement the diet with non-protein nitrogen. For the pasture team, the aim was to see if the development of legume production paddocks actually resulted in an improved diet, particularly over the dry season.
Seeking more info on FNIRS? Check out this page →
First go with 2 new pastures
On two grazing demonstration sites, Blanncourt and Whitewater, the team tried faecal sampling to understand how the diet changes over the season. Dung samples were collected every 4-6 weeks, processed and submitted for FNIRS analysis to Gcology Data Services Pty. Ltd. The turnaround time was 1-2 weeks even though the samples were sent to Western Australia for analysis, with the results emailed as an Excel™ spreadsheet.


How did the results pile up?
Blanncourt
‘Blanncourt’ (Cheryl and Glen Connoly) where a leucaena and buffel grass pasture (65 ha with two cohorts of steers 40 at 425-500 kg) was compared to a native grass + buffel grass pasture (280 ha with two consecutive cohorts of steers (150 and 120 head at 225-425 kg)), both on fertile alluvial soils. It should be noted that the native grass + buffel paddock had some infertile gravelly ridges which grew less pasture. Grazing occurred over the wet and dry seasons. Both groups of cattle had access to wet season phosphorus supplements and dry season lick. Cattle liveweight was monitored using Optiweigh™ units.
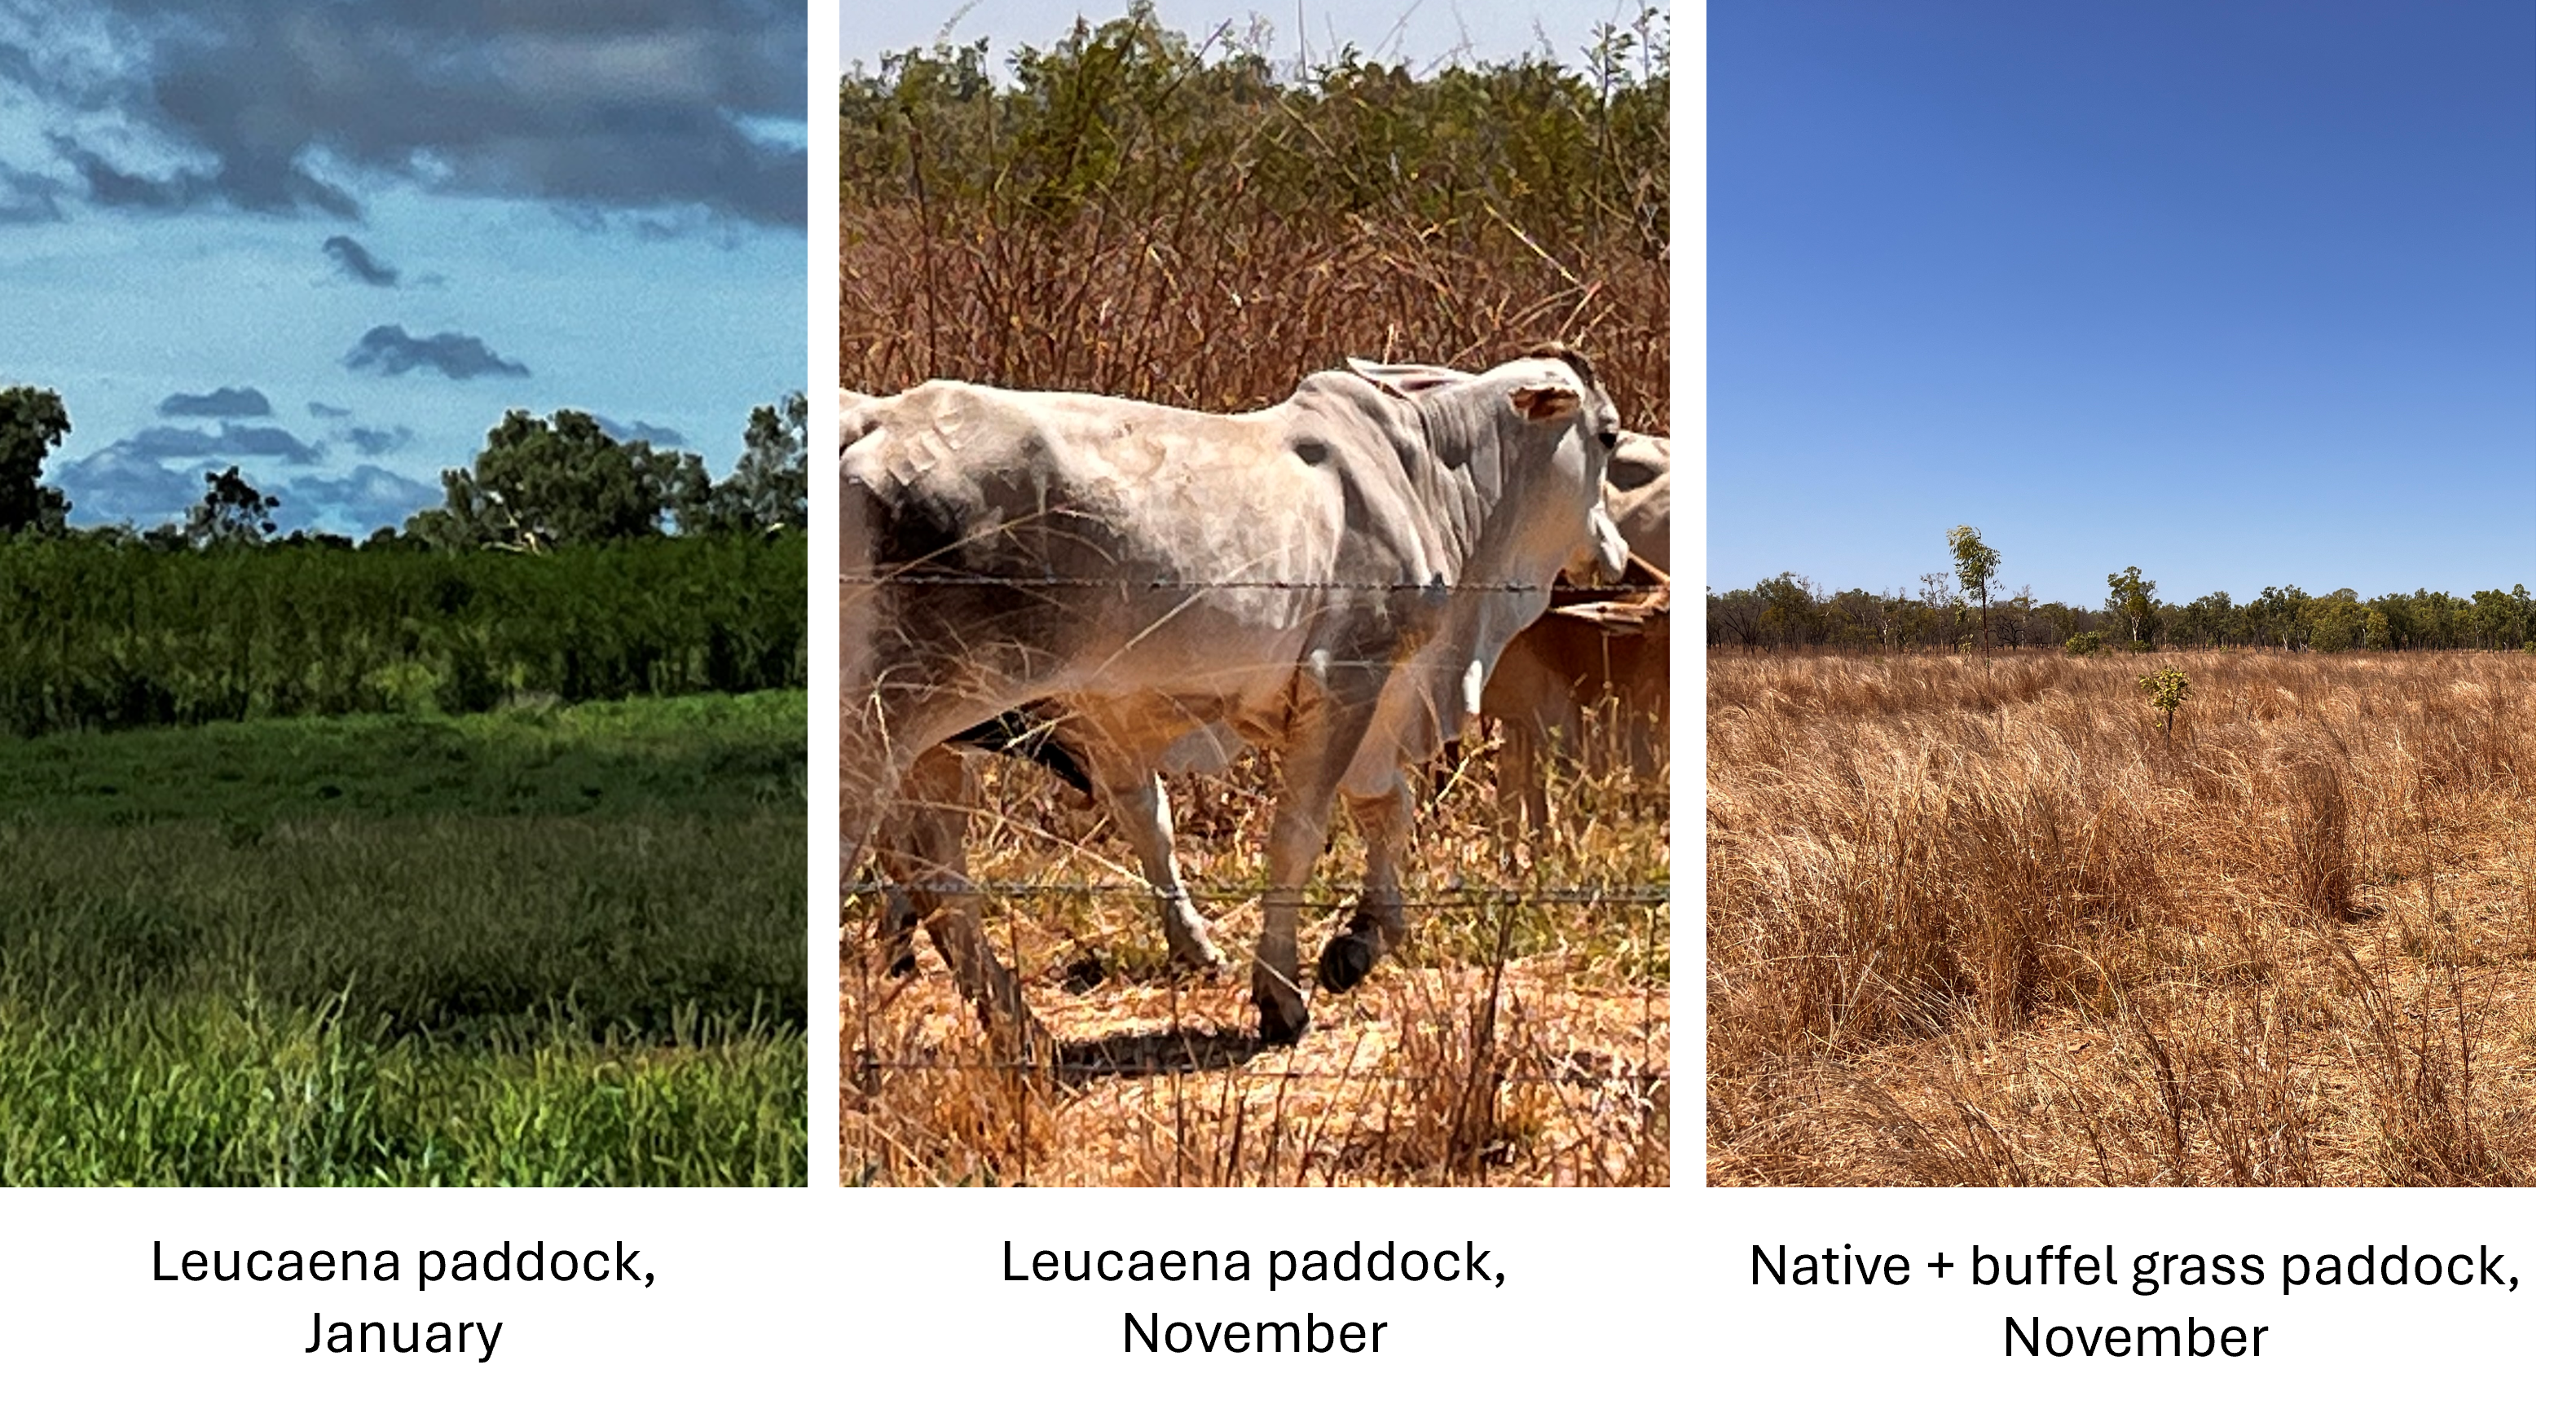
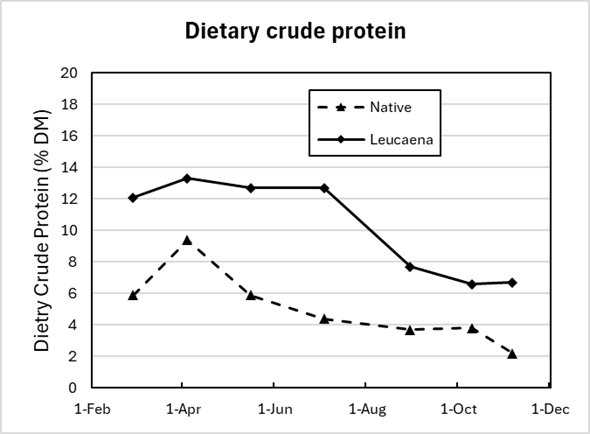
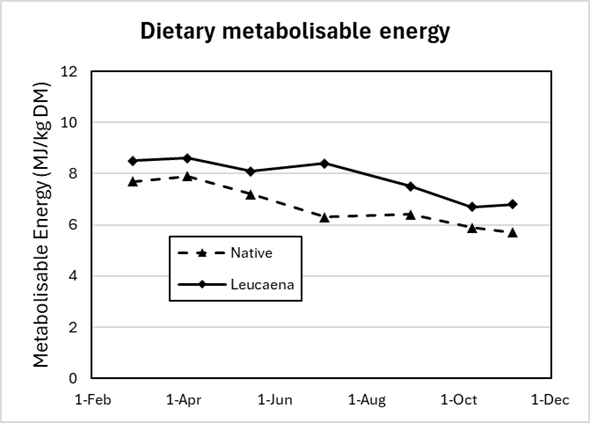
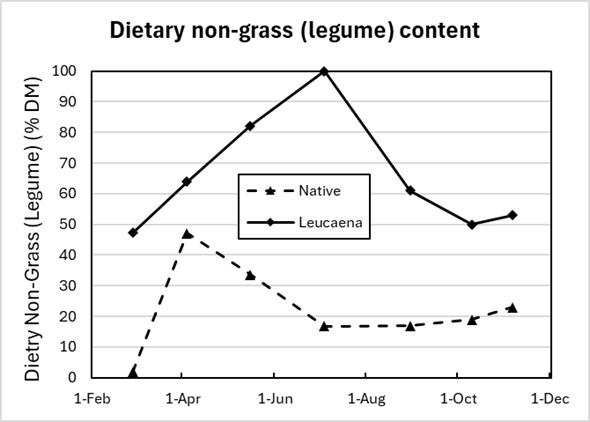
The dung testing at ‘Blanncourt’ showed a clear difference in diet quality between the leucaena and native + buffel grass pastures as seen in the photos and graphs below. Dietary crude protein and metabolisable energy levels were relatively high in both paddocks during the wet season, but the protein levels (12-13%) were markedly higher in the leucaena paddock. The native grass pasture lost feed value progressively during the dry season, whereas high diet quality was maintained in the leucaena paddock until August-September. Even then dietary crude protein levels were maintained above 6% which would help support pasture intake levels. The decline in diet occurred when the leucaena component of the diet also declined, which corresponded with a slow-down in the growth of leucaena leaf over the mid dry season.
The cattle were weighed using Optiweigh™ units over the whole season. Although cattle were less likely to enter the units during the wet season, higher numbers were measured once dry season lick was supplied and the units provided useful weight data (see table below). There were two, almost consecutive, cohorts of cattle in each paddock, introduced at similar times. The average weight gains before July were excellent in the leucaena paddock at around 1.0 kg/hd/day, and double what was recorded on the native + buffel grass pasture. Animal growth rates declined thereafter, but remained positive (0.1 kg/hd/day) in the leucaena paddock whereas cattle lost weight in the native grass paddock. This all points to the legume pastures providing the capacity for animals to select a high-quality diet over an extended period resulting in better cattle performance, even at higher stocking rates.
| Grazing days | Ave. daily gain (kg/hd/day) | Ave. weight change (kg) | Number of recorded head* | |
|---|---|---|---|---|
| First cohort (up to 25 June) | ||||
| Leucaena | 84 | 1.023 | 86 | 24 |
| Native + buffel grass | 77 | 0.446 | 33 | 9 |
| Second cohort (25 July – 7 November) | ||||
| Leucaena | 105 | 0.146 | 15 | 19 |
| Native + buffel grass | 105 | -0.433 | -45 | 20 |
* number of cattle with repeat measurements through the Optiweigh scales.
Whitewater
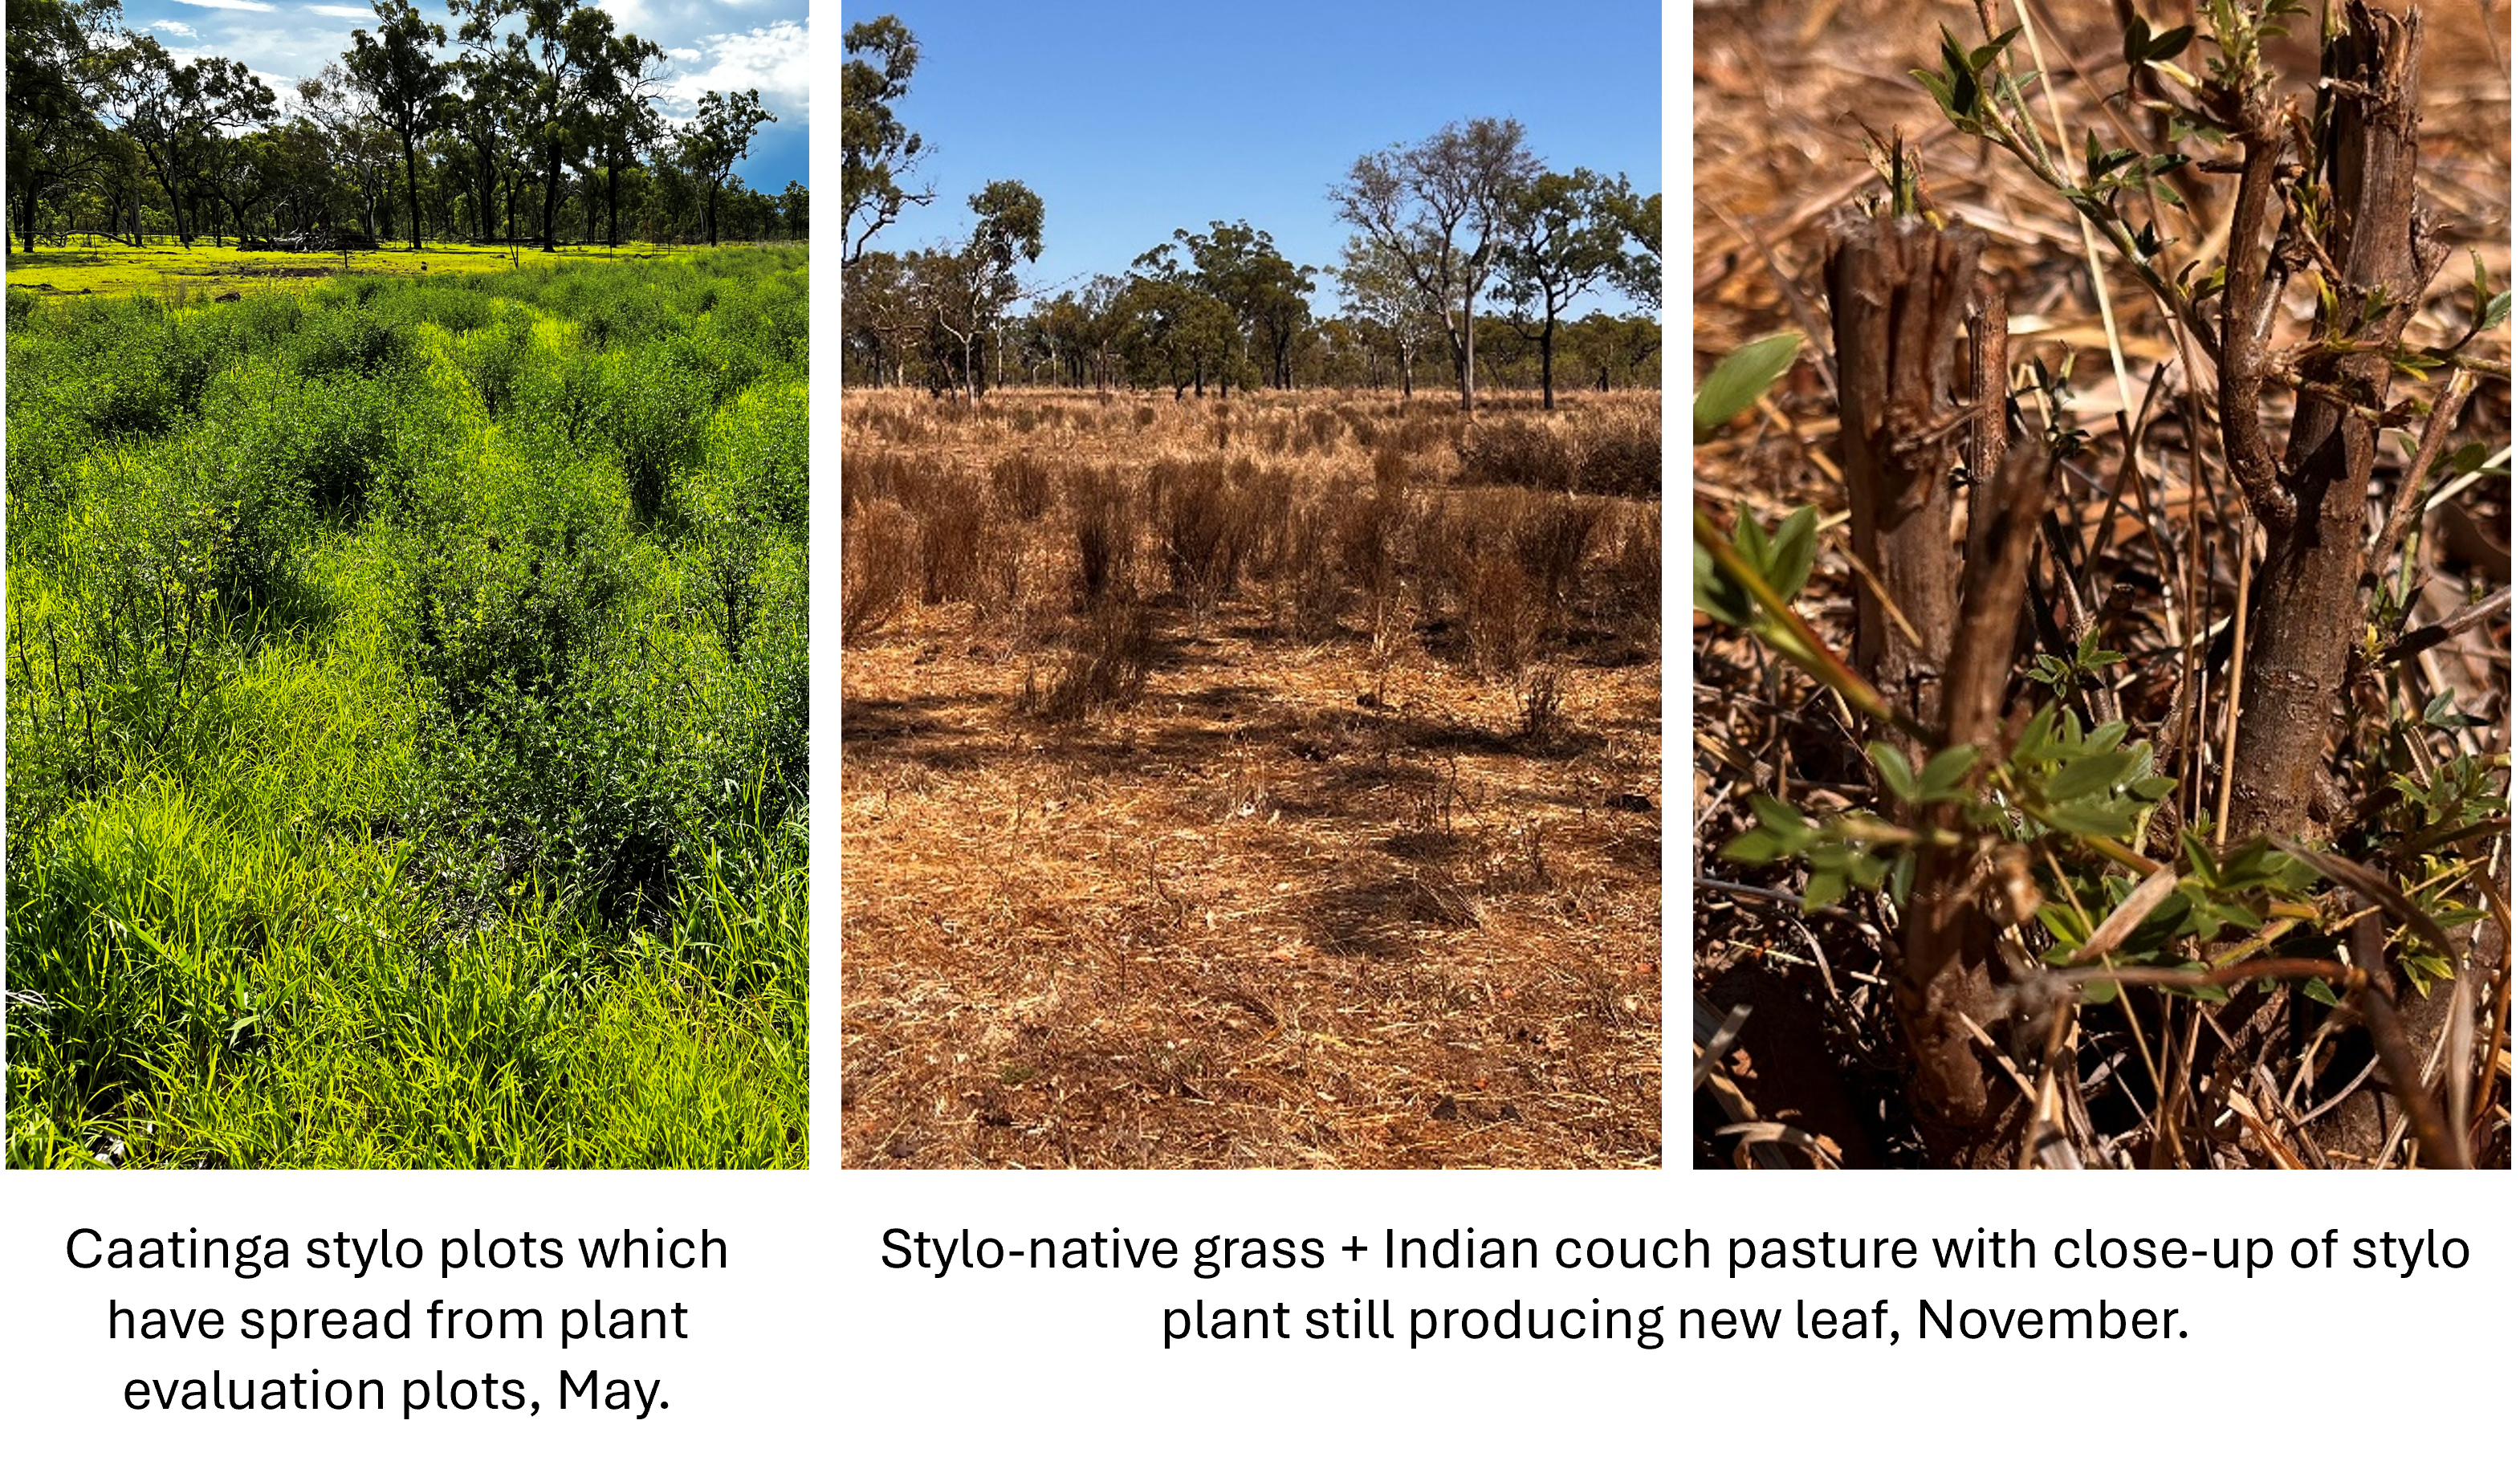
The second site was ‘Whitewater’ (Christine and Tom Saunders) where a 6-ha paddock in which stylos and butterfly pea had spread from evaluation plots into native pasture dominated by black speargrass, Indian couch and grader grass was compared to a large, unimproved breeder paddock which was immediately adjacent and stocked with cows and calves. Both were uncleared. The soil type was a red basalt with very high phosphorus but low sulphur. Six heifers (avg. 227 kg/hd at entry) were introduced to the legume paddock in September and grazed to determine diet quality at the transition from the late dry season and into the wet season. Both groups had urea supplied by dosing of the water supply.
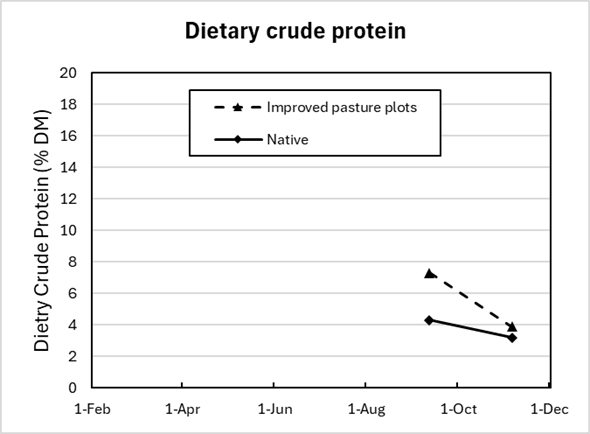
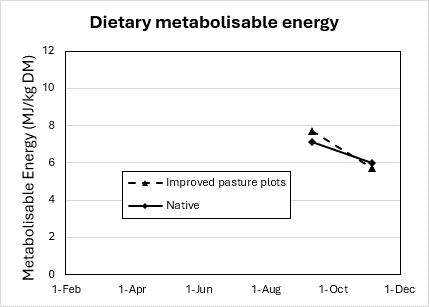
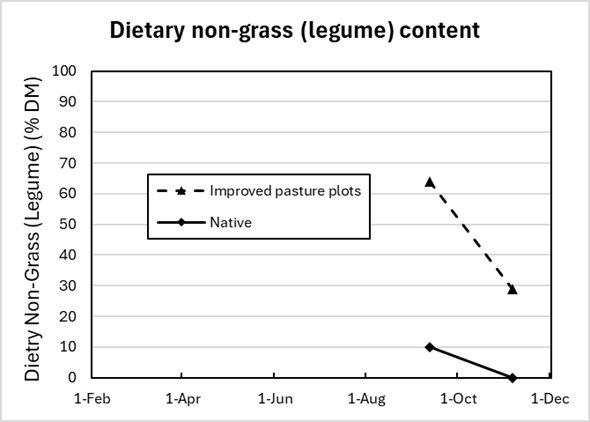
Stylos and butterfly pea had spread across most of the site, but were most prolific near the three original areas of pasture plots and the water corner. The site had been spelled for a few months and the stylos were still producing leaf, whereas the grasses had hayed off. Dietary crude protein levels (around 8%) in the legume paddock were almost twice that of the adjoining native pasture late in the dry season (November), but metabolisable energy levels were similar.
So, is it all down pat?
We have found the FNIRS results to line up with what is happening in the paddocks over the season and also the performance of cattle. We aim to undertake similar exercises on different properties over the next few years, weighing cattle in yards when possible or by using the Optiweigh™ units for comparison. We will have liveweight results for the heifers at ‘Whitewater’ in the next few months as we extend monitoring over the early wet season. Knowing the diet digestibility of feed also allows us to do more accurate economic analyses as stocking rates are based on dry matter intake which in turn is determined by diet digestibility over the year. We will be including the diet quality data we get from the grazing demonstrations to fine tune the economic analyses on production paddocks. So, overall, we find faecal NIRS to be a useful tool for understanding the interaction between our pastures, diet quality and how the cattle perform.
For information, get in touch with the NQ team.
| Research | Extension |
|---|---|
| Kendrick Cox Mareeba 0348 138 262 kendrick.cox@dpi.qld.gov.au | Karl McKellar Charters Towers 0418 189 920 karl.mcKellar@dpi.qld.gov.au |
| Craig Lemin Mareeba 0467 804 870 craig.lemin@dpi.qld.gov.au | Bernie English Mareeba 0427 146 063 bernie.english@dpi.qld.gov.au |
This work is part of The Queensland Pasture Resilience Program, a partnership between the Department of Primary Industries, Meat & Livestock Australia, and the Australian Government through the MLA Donor Company.