Live assessing to meet market specifications
An important step in selling cattle is being able to match the live animal to your target market specifications. Common traits to measure include sex, dentition, liveweight, carcase weight, P8 fat depth and possibly muscling. The first three involve looking and weighing. Cattle scales and a head bale are essential tools for the beef business.
Estimating carcase weight from the live animal requires measuring liveweight and multiplying by an estimated dressing percentage. Dressing percentage is affected by the class of stock, fatness and muscling.
Assessing fatness
Assessing fat cover is probably the most important skill in live animal assessment. The fatness relates directly to carcase yield, i.e. waste and is also related to quality. Methods of assessment include:
- visual – based on live animal observations of key indicator sites;
- manual – performed by palpating the live animal at key sites;
- objective – performed by ultrasound scanning of the live animal;
- past records – feedback on previous cattle of similar genetics and background is useful.
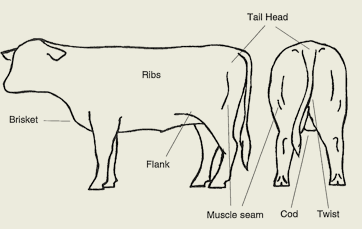
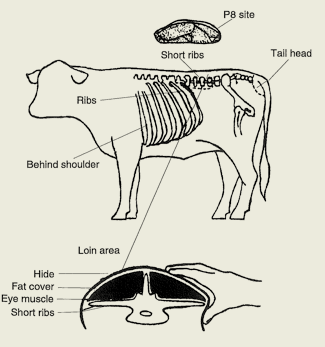
To assess fat cover, the sites where only fat is laid down should be inspected which are the short ribs, tail head, and long ribs.

Diagram 1. Points for visual assessment (Adapted from ‘The Australian Feedlot Directory’ 1994, p19)

Diagram 2. Points for manual assessment (Source: ‘CALM Service Manual’ 1994)
As cattle fatten:
- ribs become less visible;
- tail head softens with rounds of fat increasing beside the tail;
- muscle seams of hindquarters become covered with fat and are less evident when cattle walk;
- brisket, flank, cod and twist fill out, giving cattle a square appearance compared to the roundness of muscle shape.
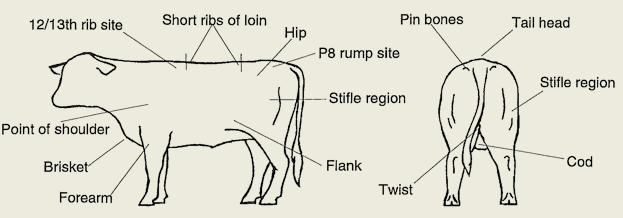
Fat scores range from 1 (lean) to 6 (very fat). These relate to the depth of fat in millimetres (mm) at the P8 site on the rump. The term P8 is simply an abbreviation for position 8. The P8 site is defined as the point at the intersection of two lines: one line extends down the side of the animal from the ‘highbone’ (crest of the third sacral vertebrae) and the other line extends parallel to the backbone along the side of the animal starting from the pin bone. See Diagram 3 below for a visual depiction of the P8 site. A description of what to feel for in assessing fat depths is described in Table 1.
Table 1. Description of fat scores
| Fat thickness P8 rump (mm) | AUS-MEAT fat score | Description |
|---|---|---|
| 0 to 2 | 1 | No fat around tail head. |
| 3 to 6 | 2 | Short ribs of loin sharp and easily distinguished, hip bones and ribs are hard to the touch. |
| 7 to 12 | 3 | Short ribs can be individually felt but feel increasingly rounded. Ribs clearly felt. Hip bone still quite hard and only light deposit of flank fat and around tail head. |
| 13 to 22 | 4 | Short ribs only felt with firm pressure. Moderate fat cover. Hip bone carrying some fat cover. |
| 23 to 32 | 5 | Short ribs cannot be felt or need very firm pressure. Ribs and hips well covered. Tail head fat as slight mounds, soft to touch. |
| 33+ | 6 | Hard to distinguish bone structure. Tail head buried in fatty tissue. All other sites show obvious soft fat deposits. With a hand placed flat over the ribs behind the shoulder, it is difficult to detect these ribs. |
Source: ‘CALM Assessment Manual’ (1994)
In general, feeder steers entering the feedlot are required in a fat score range of 2 and low 3. The feedlot does not want already finished cattle at entry.
Fat scores generally required for some finished cattle markets are:
| Domestic | 2 to low 4 |
| Korea | 2 to 4 |
| Japan and EU | High 3, 4, and 5 |
| US manufacturing | any, lean preferred |
Yield potential – muscle assessment
Body composition, consisting of muscle, bone and fat, all contribute to the ability of a live animal to be converted to saleable meat. There are a number of key indicator sites for muscle definition on the live animal.

Diagram 3. Reference points used when assessing live cattle (Adapted from ‘The Australian Feedlot Directory’ 1994, p19)
Yield is a high priority for processors and fabricators of meat products because it relates to processing efficiency. Yield is predominantly affected by the proportion of muscle and fat. It may be assessed in the live animal or in carcase form. Heavily muscled cattle produce higher yields than lightly muscled cattle.

Diagram 4. Muscle scores (Adapted from ‘The Australian Feedlot Directory’ 1994, p20)
Live assessment of muscling uses a subjective system of scoring from A (very heavy) to E (very light). Fat and muscle can easily be confused in the live animal. To minimise confusion, it is best to assess fat first before moving on to muscle.
The best method to assess muscle is to view an animal from behind and assess the thickness through the lower hindquarter (stifle area); heavy muscle cattle are thickest through the stifle. Also the stance of cattle will give an indication of muscling, well muscled cattle have a wide stance. Lightly muscled cattle will have a narrow stance and the gut can be seen from the rear. Muscle will bulge and ripple as an animal walks, while fat will wobble and give an animal a smooth appearance. The thickness through the backline and shoulders should also be viewed when assessing muscle.
Assessing muscling in feeder steers
Assessing the potential of a feeder steer to develop muscle is very difficult, but important. Lightly muscled cattle will finish earlier lay down more waste fat, particularly on a long feed program. Heavier muscled cattle will have a better dressing percentage and higher yielding carcase at the same liveweight. Muscling can be independent of frame, you can have both large and small frame cattle that are heavily muscled.
The new interactive National Bovine Livestock Language Guidelines can be accessed for free on the AUS-MEAT website.
Estimating carcase weight
Estimating carcase weight from the live animal requires estimating dressing percentage. The dressing percentage is calculated as carcase weight divided by liveweight x 100. For example, a 216kg carase divided by 400kg liveweight x 100 = 54% dressing percentage.
Table 2. A guide to calculating carcase weight from liveweight
Estimated dressing percentages: all figures on a Hot Standard Carcase Weight basis (approximately two hours off pasture)
| Fat score | Fat depth (mm) P8 rump site | Vealers, yearlings | Young cattle, steers and heifers | Heavy steers | Cows <200kg | Cows 200–250kg | Cows >250kg | Bulls |
|---|---|---|---|---|---|---|---|---|
| 1 | 0–2 | 49–50 | 50–53 | 48–52 | 38–40 | 41–44 | 42–45 | <200kg 48–54 |
| 2 | 3–6 | 50–53 | 51–54 | 50–53 | 39–41 | 42–45 | 43–46 | 200–300kg 53–57 |
| 3 | 7-9 10-12 |
51–55 52–56 |
52–55 52–56 |
51–54 52–55 |
40–42 41–44 |
45–50 46–53 |
44–48 48–50 |
>300kg 54–58 |
| 4 | 13–15 16–21 |
53–57 | 54–57 55–58 |
53–56 54–57 |
43–48 46–49 |
47–52 49–51 |
50–50 50–55 |
|
| 5&6 | 21+ | 56–59 | 55–58 | 47–50 | 50–56 | 51–56 |
Source: Dressing percentages for cattle, PRIMEFACT 340 January 2007, NSW Primary Industries
- As a guide use the lowest figure of the range for cattle with muscle score D, the upper figure of the range for cattle with muscle score B and the midpoint for cattle of muscle score C.
- For saleyard dressing percentage comparisons allow for a higher dressing percentage as stock will generally be off feed for a long period prior to weighing, that is add 2% to above figures.
- If the abattoir weighs carcases on a ‘fats in’ basis (i.e. kidney fats and channel fats in) increase dressing percentage figures by two units for fat score 5 and 6, by 1.5 units for fat scores 3 and 4, by 1 unit for fat score 2 and no change for fat score 1.
| Higher dressing percentages occur with: | Lower dressing percentages occur with: |
|---|---|
|
|
Source: ‘Cattle assessment manual’ (CALM 1994)
More information
Roger Sneath, Department of Agriculture and Fisheries.